Covid19 visualizer – Website that tracks Corona Virus related issues.

A website is known as ‘Covidvisualizer.com‘ has been developed in the US to help users to visualize the earth and to track down the cases, deaths, and recoveries associated with the deadly Corona Virus (COVID 19).
This website follows the mismatched media reports on COVID 19 across the world which make it difficult to get a single information source.
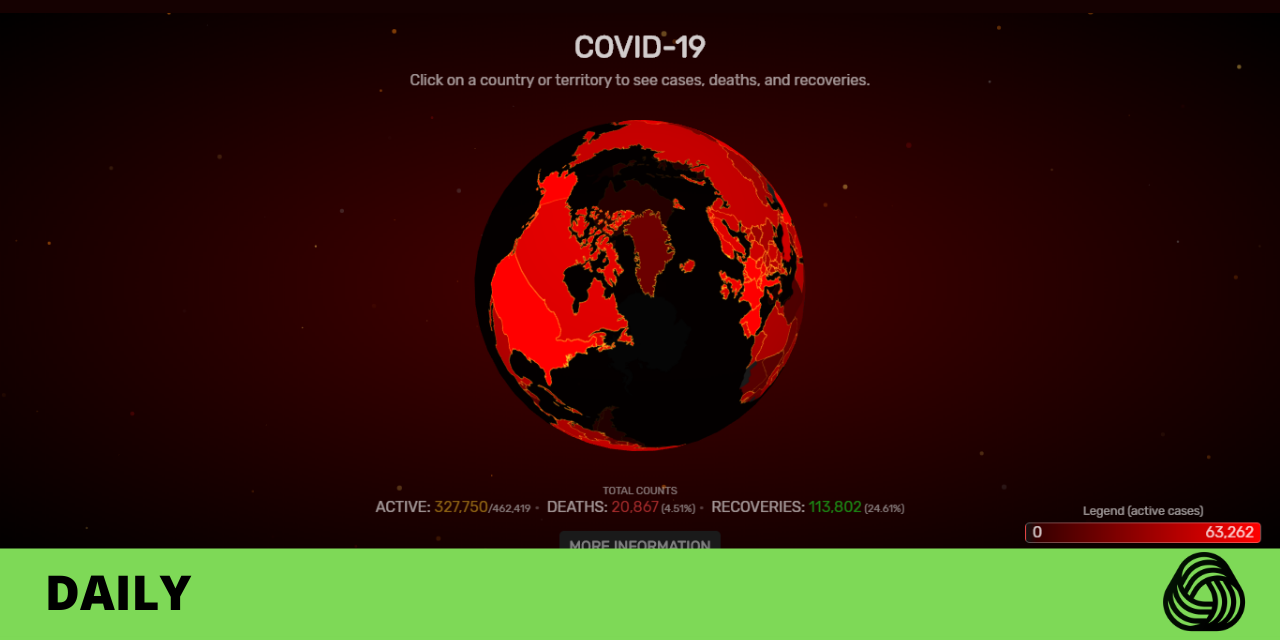
Covidvisualizer.com allows users to select any country or territory of choice to receive information about the pandemic.
According to the developers, Navid Mamoon and Gabriel Rasskin of Carnegie Mellon University, the website aims to provide a simple, interactive way to visualize the impact of COVID 19.
The developers wrote on their website “We wanted people to be able to see this as something that brings us all together. It’s not one country or another country; it’s one planet — and this is what our planet looks like today”.
The website uses data from real-time updates on Worldometer, a platform that provides counters and real-time statistics for diverse topics, utilizing reliable sources from around the world.
The website features a simple interface with a 3 D red and black slowly revolving globe with yellow shades that mark the difference of the most and least affected regions. Users can stop at the country of their choice.
The Coronavirus pandemic has become one of the biggest threats humanity has ever faced and has made most people yearn for the latest information on the cases.
Currently, the confirmed cases of Coronavirus around the globe are about 460,304 cases with 20,828 deaths.
Other COVID tracking inventions include the COVID-19 Global Case Tracker interactive map which provides users with the most up-to-date information on Coronavirus and the WHO COVID-19 situation map shows the rise in novel coronavirus infections from January to now.